

Workshop
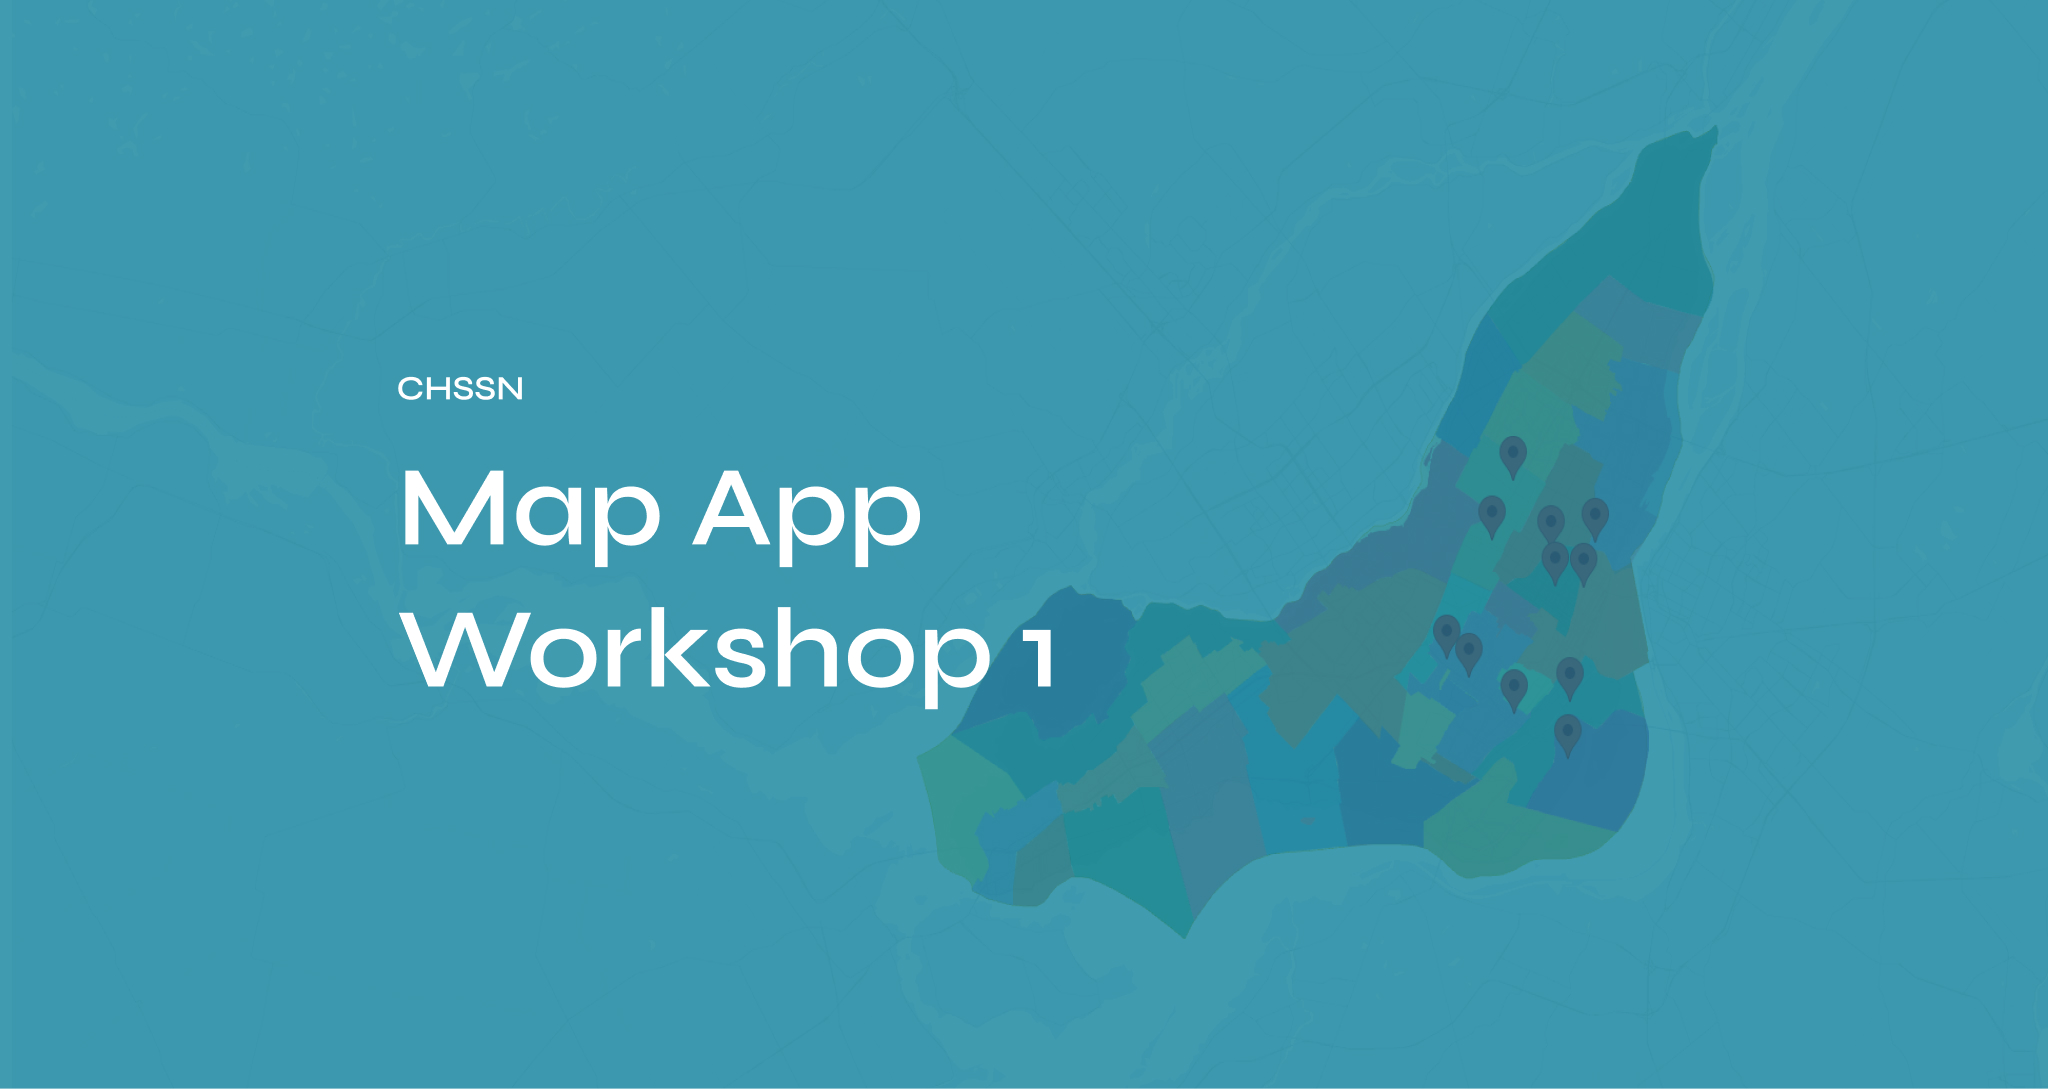
Mapping Montreal’s Community Needs : Map App Workshop 1
Mohamed Hamad
Key Insights from CHSSN’s First Mapping App Workshop
In CHSSN’s first Mapping App workshop, participants explored the platform’s power to uncover data-driven insights about health and social services in Montreal. Designed for community organizations, the session provided a hands-on introduction to using the app to support service planning, visibility, and equity across neighbourhoods.
Here’s what we learned.
Seeing the Big Picture—and the Local One
Facilitators zoomed into the Island of Montreal, showcasing how the app visualizes local organizations, city and borough boundaries, and public health jurisdictions (RTS and CLSC). Each layer helps organizations understand who’s working where—and how jurisdictions overlap, which is critical when planning for service delivery.
For example, the CLSC serving Pierrefonds also reaches Île Bizard and Sainte-Geneviève, demonstrating that one provider may span multiple administrative zones.
Demographic Data That Drives Strategy
A key feature of the Mapping App is the census-based demographic dashboard. Pulled from the 2021 StatsCan census and enriched by Jay Pocock Research Consulting, the data includes:
- Linguistic profiles (English, French, bilingual)
- Age and household structures
- Education and income levels
- Immigration and visible minority breakdowns
This allows users to explore correlations—such as the gap between the number of Hindi-speaking seniors and the services available to them.
Find Gaps. Build Bridges.
Participants learned how to use filters to surface service gaps by language, age, delivery method, and demographic group. Want to know where seniors in a particular minority group live—and whether they’re served in their preferred language? The Mapping App can show you.
This level of insight helps organizations make informed decisions about program design, funding proposals, and partnership opportunities.
Final Takeaway
CHSSN’s Mapping App isn’t just about data—it’s about equity. The platform helps ensure that Quebec’s English-speaking and minority communities aren’t invisible in planning conversations. By mapping needs and services side by side, the app empowers users to spot gaps, share knowledge, and strengthen collaboration across the province.